
When you want to find out what a home is really worth, the price per square metre is a useful benchmark, but it is not the final answer. The relationship between home size and price is not a straight line in which twice as many square metres automatically means twice the price. That is why two homes in the same town can end up with very different prices per square metre, even though they look alike on the surface.
Look at the figures for 2026. The average price per square metre for houses nationwide reached 19.521 kr. in the 2nd quarter of 2026, the highest price ever. In the same period, owner-occupied flats cost an average of 44.816 kr. per m², also a new record and an increase of 18,6 per cent in a year. These two figures alone show that the type of home plays a big part in what a square metre costs.
Put a figure on a whole home and the picture becomes even clearer. A typical 155 m² detached house passed 3 million kr. in the 2nd quarter of 2026, the first time the price of an average detached house has gone above 3 million kr. An average 79 m² flat cost 3,5 million kr. in the same quarter. Note that the flat is roughly half the size of the detached house, yet more expensive overall.
A small home often has a higher price per m² than a large one.
What counts towards the living area – and what does not
The price per square metre of a home is calculated only from the residential floor area registered in BBR (the Danish building register). That is why it matters what is included and what is left out when you judge whether a price per square metre really makes sense.
The following count towards the living area:
-
Living rooms and bedrooms form the core of the residential floor area registered in BBR. They are what count towards the price per square metre.
-
A converted loft counts if the ceiling height is over 1,5 metres, but it is often registered incorrectly in BBR.
The following do not count:
-
A basement does not count towards the living area. It is measured separately and adds a lower value per m² than the living area.
-
A garage, carport, uninsulated conservatory or covered terrace does not count. They can add value when you sell, but not extra BBR square metres.
Because it is the registered residential floor area that drives the figure, the picture can look different from how spacious the home actually is.

Why the price per square metre falls as the home gets bigger
Take a 90 m² house and a 200 m² house in the same neighbourhood. The small house typically has the higher price per square metre, and the explanation lies in which rooms take up the space. Kitchen, bathroom, hallway and technical installations are expensive to build, and both houses have them. The large house simply has more living rooms on top, and they cost less per square metre. That is why the average per m² falls the more square metres you add.
That is also why you cannot multiply the municipality’s average price per square metre by your floor area and assume you have the value of your home. The method only holds if your home is close to the local average in size. If it differs markedly, the calculation gives a skewed picture, because the average is based on homes that are put together differently from yours.
The plot is not included in that figure either. Two identical houses can sit on plots of 600 and 1.400 m² and be hundreds of thousands of kroner apart in price, without the difference showing up in the price per square metre at all. The plot is measured separately and is not tied to the living area, so a large plot can lift the selling price while the price per square metre stays the same.
The same applies when you extend. An extension rarely pays back its own price per square metre in value, because the new square metres are typically cheaper rooms than the ones the home already has. A well-planned extension can, however, typically increase the value of the home by 60-80 % of the total building costs, depending on size, quality and location. So you do get something back, just not krone for krone.
Size affects the price of a home in a predictable direction: a larger floor area generally means a higher total price, while the price per square metre falls. How much size matters for the price, however, is not something you can read from the square metres alone. The exact value depends on the plot, the condition, the location and which rooms are actually involved.
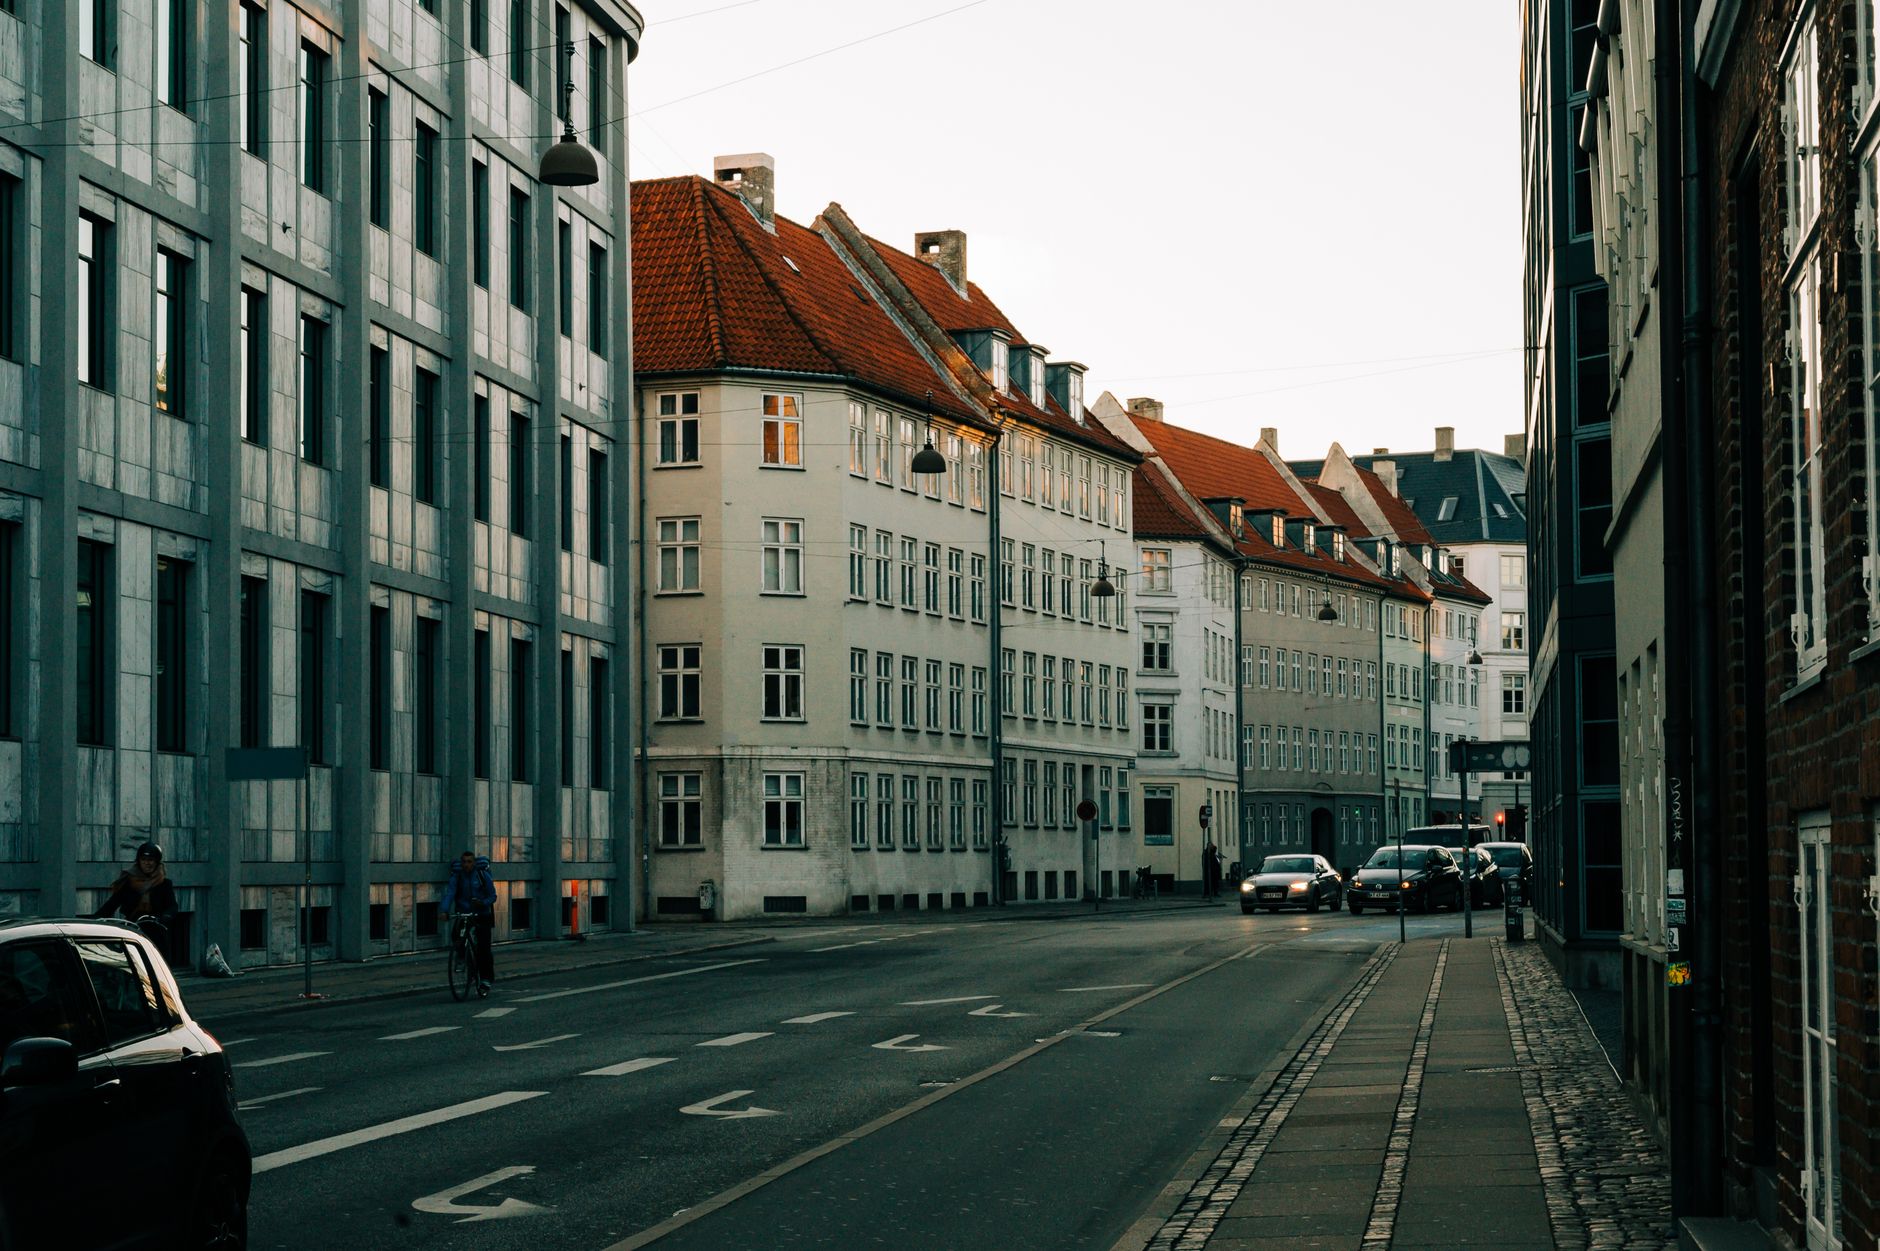
How much location matters for the price per square metre of houses and owner-occupied flats
Location is the single factor that does most to move what a square metre costs. We are not talking about a difference of a few thousand kroner between expensive and cheap. We are talking about prices that are many times higher, and that applies both when you look at the price per square metre for houses and when you look at the price per square metre for owner-occupied flats.
The table below brings together the extremes in the 2nd quarter of 2026, so you can see the range at a glance.
| Area | Property type | Price per m² (2nd quarter 2026) | Price of a typical home |
|---|---|---|---|
| Gentofte | House | 70.117 kr. | Approx. 11 million kr. for a 155 m² house |
| Copenhagen | House | 65.642 kr. | Not stated |
| Lolland | House | 5.436 kr. | Approx. 843.000 kr. for a 155 m² house |
| Frederiksberg | Owner-occupied flat | 83.530 kr. | 6,6 million kr. for a 79 m² flat |
| Randers | Owner-occupied flat | 9.766 kr. | 772.000 kr. for a 79 m² flat |
In Gentofte, the price per square metre for houses broke through 70.000 kr. for the first time, and Copenhagen was not far behind. On Lolland, by contrast, houses cost 5.436 kr. per square metre, which makes the municipality the cheapest place in the country to buy a house.
For owner-occupied flats, the picture is just as stark. Frederiksberg came top with 83.530 kr. per m², the highest price ever in any Danish municipality, while Randers was the cheapest municipality in the country for owner-occupied flats at 9.766 kr. per m².
Put the two extremes for houses side by side and the difference becomes tangible. The same 155 m² house costs approx. 843.000 kr. on Lolland against around 11 million kr. in Gentofte. A price per square metre therefore only makes sense when you read it together with the area it belongs to. A figure that seems high in one place can be perfectly normal in another, and vice versa.
Interior design and functionality move the price per square metre more than you think
To understand what a home costs per m², it helps to know how the factors that actually push the price up and down rank against each other. They do not all carry the same weight.
-
Location and neighbourhood are number 1 for the price.
-
Living area and plot size are number 2.
-
How usable the layout is comes in at number 5.
-
Interior design and colour choices rank lowest, at number 10.
Note where the last two come. Interior design and colour choices matter less for the final selling price, but they do affect how quickly the home sells. In other words, they do not move the bottom line as much as they move the time the home spends on the market.
The usability of the layout is another matter. A functional layout is one of the most sought-after features, and well-thought-out placement of living areas, sleeping areas and storage can make a house feel much roomier than its actual number of square metres. That is why two homes with the same floor area can feel very different when you stand in them.
Buyers often pay extra for tailor-made solutions such as walk-in wardrobes, custom-built kitchen islands and integrated home offices. Energy-efficient lighting, double-glazed windows and smart thermostats signal modern design and increase market value. The interior makes the home easier to sell. It also raises what a square metre can actually fetch.
How to use the price per square metre correctly as a buyer or seller
The price per square metre is a tool, not a verdict. Use it to get a sense of the level, then let the specific features of the home decide the rest. Here are the three things that most often go wrong when a home’s value per m² is worked out the wrong way.
-
Use the municipality’s average price per square metre as a benchmark, not as the final answer. Neighbourhoods within the same municipality can be 30 % apart, and a few sales in a single new housing development can pull the average up, so the figure does not reflect what you actually have.
-
Always check the BBR notice before you value a home. If the floor area is registered incorrectly, especially converted lofts and outbuildings brought into use as living space, the error carries over into both online calculators and the estate agent’s starting point, and you end up working from the wrong basis.
-
Size is only one factor. Layout, light, noise, a balcony, parking and shared costs can significantly change what buyers are willing to pay, without it showing in the register data, so two homes with the same floor area can end up with very different prices.
Notice that none of the three points is about finding a better average. They are about knowing when the average no longer says anything about your particular home. A municipal figure can be entirely correct and still miss the mark if your neighbourhood is more expensive than the rest, if the BBR floor area is wrong, or if the home is on the third floor without a balcony.
That is also why it rarely pays to base your own valuation on national averages. Those figures cover the whole country and mix everything from Lolland to Gentofte, and they cannot tell a well-designed home from one that merely has the same number of square metres. You end up with a figure that looks precise but does not fit any particular place.
If you want a figure that actually fits the home you have, the safe route is to ask Brikk for a specific valuation of what your home is worth per m² and what it could sell for, so you do not have to guess from national averages.
Leave a comment